Drawbly ↗

Step by step · Observability

Read a slow trace in three passes

This example request took 900 ms. Look at the whole request, then its child spans, then choose the next question.
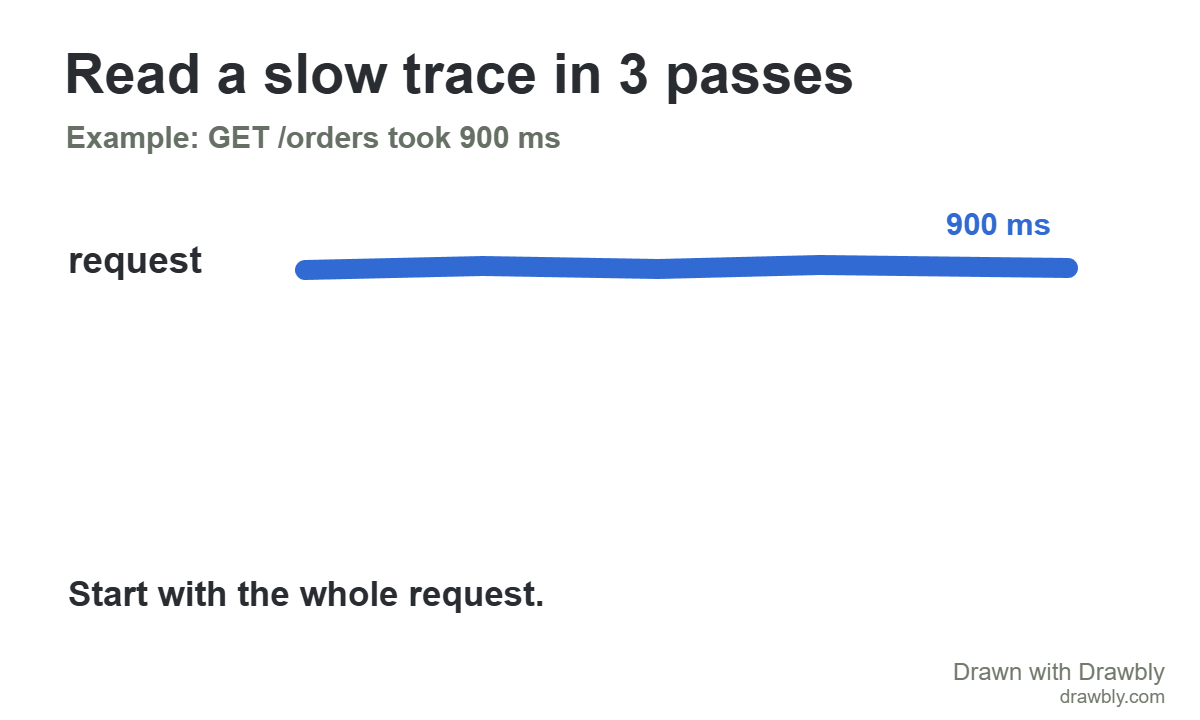
A 900 ms GET orders request span appears alone.
1. Start with the total request. Open the image to see full size.
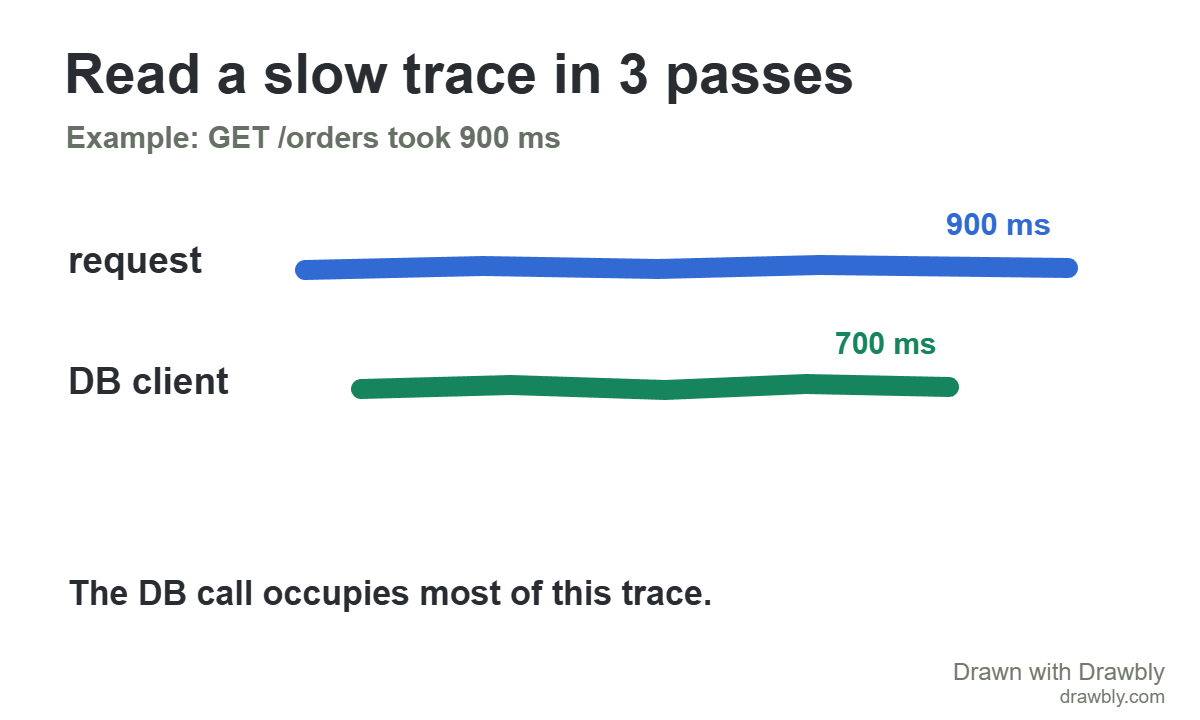
A 700 ms DB client child span appears inside the 900 ms request.
2. The DB client call occupies most of this trace. Open the image to see full size.
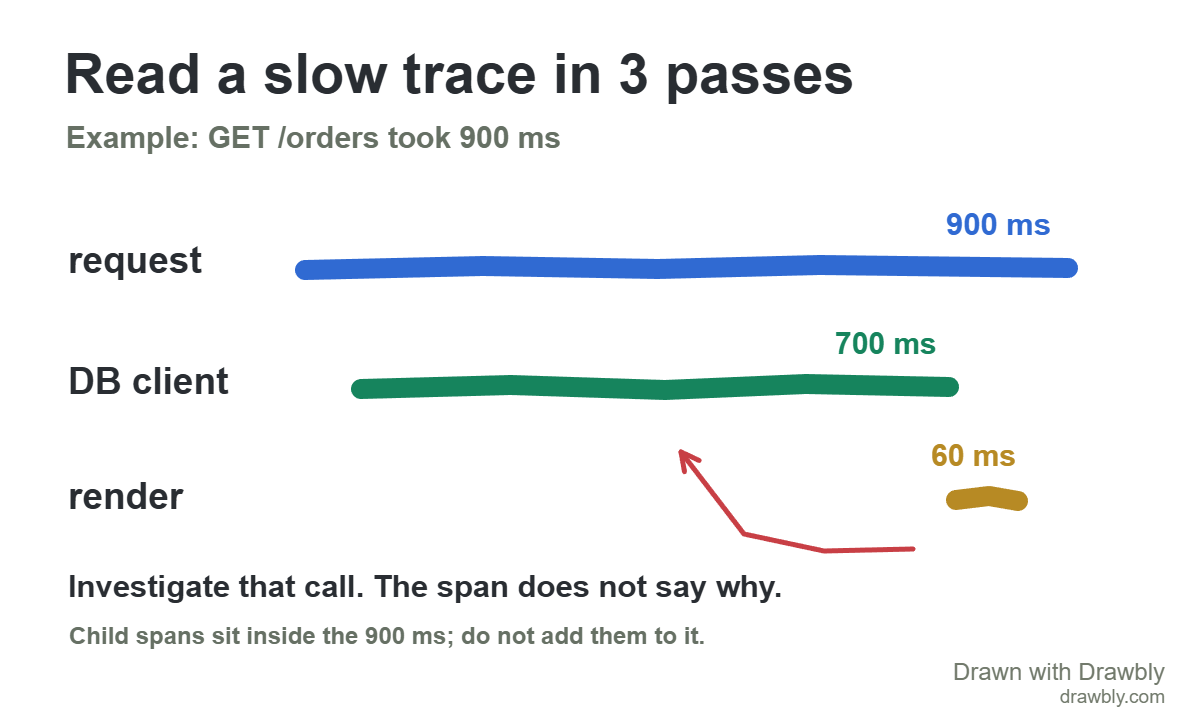
A small 60 ms render span appears; an arrow points back to the 700 ms DB client span for investigation.
3. Investigate the long call. The span shows where time went, not why. Open the image to see full size.

Child spans occur inside the parent request. Do not add 700 ms and 60 ms to 900 ms. The trace points to a useful next check, such as query timing or waiting, but cannot diagnose the cause on its own.

Watch the three views

Silent 11-second scene video, made from the editable views. Each scene retains the free Drawbly credit.

View and edit a copy

The editable drawing is carried in the link. It is not saved to a cloud account. These example marks were composed with an agent in Drawbly.

Reference: OpenTelemetry: traces and spans.

← Compare a timed-out POST before and after a retry key