Drawbly · Your ideas, in your own lines
Make someone look right here.
An image provides the context. Your marks explain what to notice.
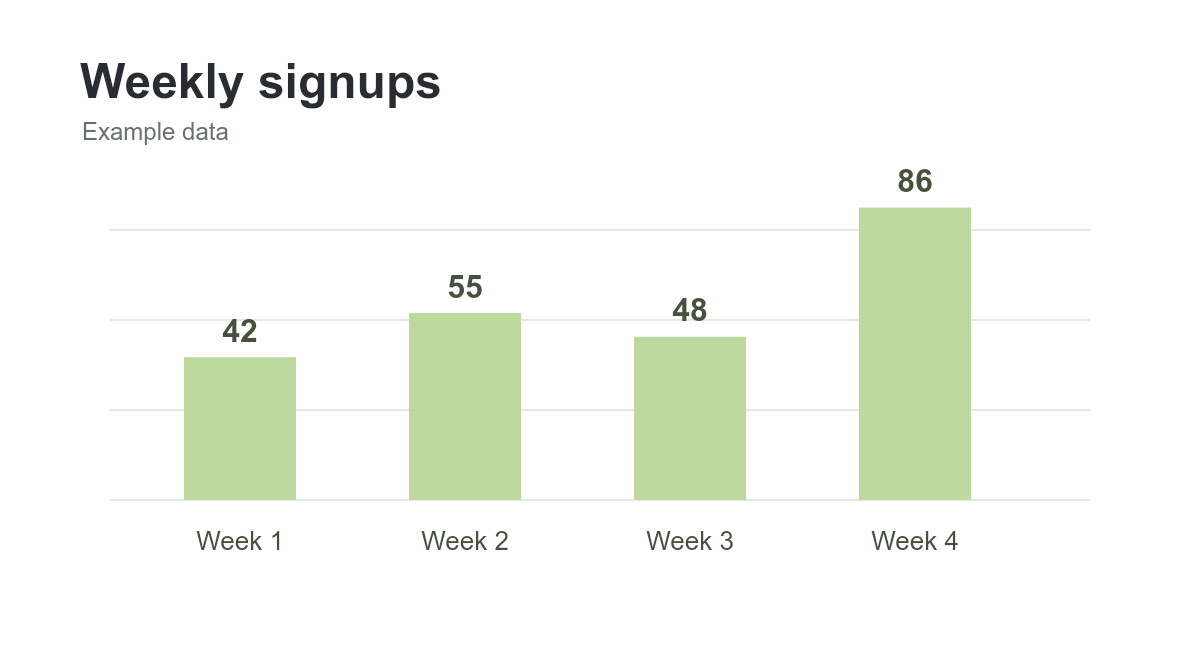
Original teaching chart with example data.
01
Bring in the image.
Choose Image above the canvas, then select your PNG, JPEG or WebP. Try the sample chart above.
02
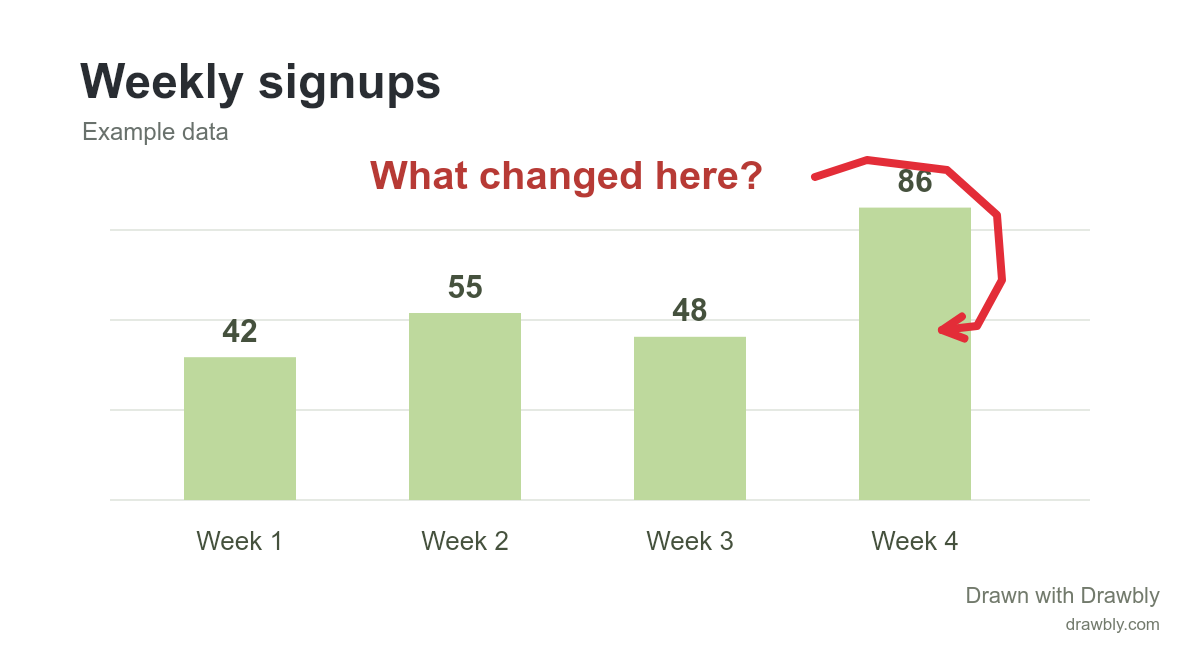
Add one arrow and one thought.
Use Arrow to point at the detail. Choose Text and explain why it matters. Keep the label away from the thing you’re pointing to.
03
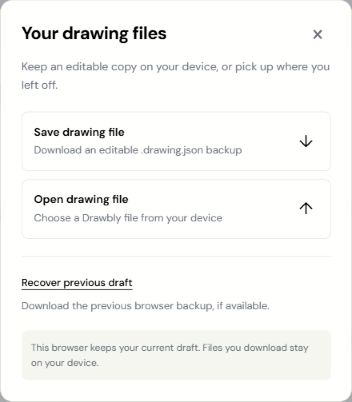
Keep the version you can edit.
Choose Export PNG to share the annotated image. Use Files → Save drawing file to keep the background and marks editable.
A few things worth knowing
Importing an image does not upload it to cloud drawing storage. Use images you have permission to share and remove private details before publishing. Free exports include Drawbly credit.